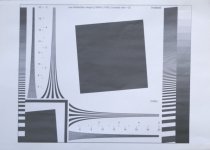
I think I've found a solution. On the link below is a basic Imatest chart and it's in SVG format. It has all the parts we need and can be edited with an SVG editor to form your own chart. There's also a link for a free SVG editor which I've been playing around with this morning. It should be pretty simple to come up with a new chart similar to what we have now and be in the highest quality possible.
To give everyone a fair chance at printing it should be made available in SVG format and say a TIFF format but not jpeg. With the free SVG editor there's no reason for anyone not being able to print at the highest quality possible on their printer an if needs be they can just use the TIFF.
Link with charts and useful info on editing, printing etc.
http://www.imatest.com/docs/testcharts_SFR_SVG.html
Chart is here
http://www.imatest.com/docs/images/small_chart_contrast_20.svg
Free SVG editor
http://www.inkscape.org/
They have the SVG file available as a PDF too and it's loads bigger than the ISO12233 chart. I opened it in Photoshop at something like 1200 dpi and it came up very good, way better the the ISO12233 one, not as perfect as the SVG though.
Paul.