• Welcome to BirdForum, the internet's largest birding community with thousands of members from all over the world. The forums are dedicated to wild birds, birding, binoculars and equipment and all that goes with it.

    Please register for an account to take part in the discussions in the forum, post your pictures in the gallery and more.
ZEISS DTI thermal imaging cameras. For more discoveries at night, and during the day.

Bat ID NE Scotland (1 Viewer)

Capercaillie71

Well-known member
Hi all

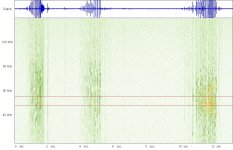
I was out last night with my bat detector checking various sites near home. Mostly I was recording pipistrelles (common and soprano) but I also got this recording, which I think might be Daubenton's. Does it look right for this species?

The recording was made from a bridge over a small tree-lined river. Although the river is quite fast flowing, there was quite a calm pool just above the bridge and the bat appeared to be flying very low over this bit of water, although it was difficult to see (it was more than 1 hour after sunset).
 

Attachments

  • Bat1.jpg
    Bat1.jpg
    287.6 KB · Views: 81
The sonogram looks good for a Myotis species, in that the signals are very rapid, over 12 a second, and long straight signals.

I think this, coupled with the fact the bat was flying low over calm water would make this Daubenton's Bat. When you say very low, I'm assuming consistently a couple of inches off the surface, hovercraft style.

Hope this helps,
Peter
 
Thanks Peter. I only saw the bat on a couple of passes, and it was very low over the water (a few inches at most). The only other Myotis that occurs in Aberdeenshire is Natterer's, and the only other resident bat species are the pipistrelles and brown long-eared.
 
I don't know what software you have, but if you can select a couple of pulses, and look at the power graph / power spectrum, that is also very useful.. The Pipistrelles will have a sharp peak at 45 (Common) or 55 (Soprano), the Myotis bats tend to have a wider, less obvious peak.
In Audacity, this would be found under "analyse" > "plot spectrum" from the top menu.
 
I use Batscan software, although I also have to use Audacity to convert the recordings (for some reason, Batscan doesn't recognise the wav files recorded by my Zoom H1).

Batscan has a function that shows peak frequency. The first graph shows the peak frequency for the recording in my original post, while the second two show Common and Soprano pipistrelles that I have recorded
 

Attachments

  • Daub.jpg
    Daub.jpg
    70.6 KB · Views: 54
  • CPip.jpg
    CPip.jpg
    74.9 KB · Views: 56
  • SPip.jpg
    SPip.jpg
    74.4 KB · Views: 57
I think that's roughly what you'd expect for Daubentons. A peak between 40 and 55, but not distinct like the Pips. So Natterer's is your next challenge ;)
 
Warning! This thread is more than 10 years ago old.
It's likely that no further discussion is required, in which case we recommend starting a new thread. If however you feel your response is required you can still do so.

Users who are viewing this thread

Back
Top