• Welcome to BirdForum, the internet's largest birding community with thousands of members from all over the world. The forums are dedicated to wild birds, birding, binoculars and equipment and all that goes with it.

    Please register for an account to take part in the discussions in the forum, post your pictures in the gallery and more.
ZEISS DTI thermal imaging cameras. For more discoveries at night, and during the day.

Konrad Siel at Swaro on "Progress in Binocular Design" in 1991 (1 Viewer)

See this for a rather good explanation of MTF (on the same page a link to the CSF image provided by Ronh).

http://www.bobatkins.com/photography/technical/mtf/mtf1.html

Particularly this graph

http://www.bobatkins.com/photography/technical/mtf/mtf2.gif

on page

http://www.bobatkins.com/photography/technical/mtf/mtf2.html

Real lenses rarely, if ever, come close to the theoretical maximum MTF at apertures below about f8 as stated above [...]

Though the measured numbers for the prisms I think show how much worse life is when looked at through a roof prisms. The MTFs are worse than say a "real f/4" lens that you would expect in the objective.

And low magnifications (and a low resolution detector ... the human eye) let you get away with quite a lot. It seems, given the typical curves for a good f/4 lens shown above, that the roof prism is the worst component in the bin. But as others (like surveyor) have shown (and discussed) elsewhere on the forum (and on Cloudy Nights) the resolution of a good bin is well above that of the human eye at that magnification (that's why you need a booster scope to do a star test with a bin)

So what is the MTF for a typical porro prism set up? What is it for a thick plate?

Some of this is prior art in this patent

http://www.google.com/patents?q=5978144

but I'm not to sure of the scale (see figure 3c): is that really a maximum of 7.00 lp/mm? The prior art device specified is an 8x21 telescope with 7 degree FOV and 13mm ER. So the Swaro prism looks good compared to this!

One thing that is clear from this patent is the MTF falls off as the beam is widened too. That's another parameter not mentioned in the Seil paper (is he measuring on axis or off axis?).

The other thing to note is the graphs presented in the paper commit the cardinal sin of graphical data presentation: they don't use the same axes scales. Essentially all the coated lines would lie over the top of each other (they all hit about 0.45 at 20lp/mm).

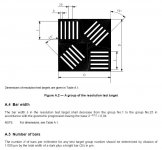
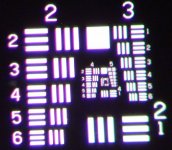
For lp/mm it's slightly exactly as Henry says: a black line and a white line is a line pair. So 5 spaced lines (lines per mm) is 10 line pairs per mm.

http://en.wikipedia.org/wiki/Image_resolution

All this reminds me of this thread (one of the others to mention MTF).

http://www.birdforum.net/showthread.php?t=102792

Here endeth the rambling ...
 
Just a whimper as I go down for a final time...

Ron,
I took 40 line pairs per mm to mean the resolution in the focal plane, suggesting a real image that then requires an eyepiece to convert to visibility. I believe this is consistent with Henry's remark that the objective is a vital part of the system, and for me to speculate very deeply without knowing its MTF is futile.

Henry,
You have actually cleared it up for me, as you see from the above. The basic MTF we see is that of the objective, and it is perturbations in that that are the aim of the paper's study of the effects of prism.

Kevin,
Thanks again for the original link, and the boatload of others, which I intend to read at least part of.

Does one realization, amid mid many more unanswered questions, count as learning? You bet! Just, sort of nonlinear is all. Thanks guys, I am proud to have met such an experienced and pretentious bunch!
Glub...
 
wow..

what a bunch of optics maniacs!! o:) Just kidding. After seeing all these discussion, I want to sign up to ASU's optical mechanical master degree to understand everything discussed here. :) it truly turned my hobby into some kind of curiosity to try to learn more about this topic. Thanks, everyone.
 
Henry,

I agree with your possible implication about editing the Wikipedia article. I should have pointed out that the first reference at the end of the Swaro paper is Warren J. Smith's book. So I have no doubt that they meant what he meant by lines and line pairs.

Unfortunately, much of Wikipedia is oriented to digital technology, written by sincere people, no doubt, but in this case not vetted in optical theory and its conventions. In my opinion, when used as a primary source of knowledge, Wikipedia can be very misleading and can sometimes do more harm than good. The quality of the articles is quite variable, and as an aggregate doesn't substitute for a good text.

Ed
 
Ronh;
Sounds good to me. I had got stuck on the object/target side of the objective, neglecting the image side. Strange for me to overlook this since my collimator has a USAF 1951 target at the focal plane, duh.

Henry/Ed;
I hope you carry this topic on awhile. I have trouble sometimes figuring out just what format people are using. In most situations, engineers and surveyors use lines per mm (each black bar and white bar are counted) most of the time. I only converted to line pairs/mm when I started viewing the BF. There are a lot of examples that I can bring up but will keep to a minimum for now. Attached is a picture of a typical level/stadia rod, a device that is mimicked for a lot of different fixtures and procedures. Notice that a black bar counts as one unit and a white bar is another unit. Between 10.6’ and 11’ there are 40 divisions, 20 black and 20 white, each being .01’ increments (50 line pairs/foot or 100 lines/foot). These spaces, both black and white, are often further subdivided by 10 by use of a vernier attachment.

I refer to the two standards frequently. Most of my work related figures are what I call detectable resolution. For instance, a lot of our cheaper instruments are only capable of 2.4 arc seconds RMS so I have to be careful that the target should at least be that size, whether it is a plumb bob string (1.5mm @ 100m=3.1” and you can see it a lot further out), a 30 mm range rod @ 2km=3.1” (easily seen at 3km), triangulation lights used at night that are 400mm diameter that we try to stay within 25km of and larger targets from mountain top to mountain top. Over the last 20 or 30 years some lp/mm requirements have come into surveying practice. The point of the above is that we can detect antennas, wires and other objects considerable smaller than Dawes would indicate and measure them but if two are close together; we may not be able to separate them. NGS and USGS, when they require instrument calibration/verification, you report resolving power in lp/mm and the angle split accuracy (the 2.4” above) is the RMS value of a number of direct and reversed observations to a single bar to measure the pointing accuracy. Some agencies still want the USAF measurements in lines/mm.

There are a lot of other applications where single line resolution is needed. A typical IR thermometer or FLIR thermograph with specifications stated in mrad have to be computed to make sure the sensitive area is completely contained on the target face to keep from mixing the background temperatures with the target value. Distance measuring equipment has the same limitations.

So as you can see, as far as I am concerned, there is a difference between lp/mm and l/mm. Until I came to BF the only time I ran into line pairs were in photography or printing applications, with an occasional pixels/mm thrown in to really confuse the issue. Still, the only time I think in lp/mm is here on BF and I try to stay with that convention. I guess the biggest difference in my optics is that most are measuring optics instead of just viewing optics.

I look forward to more clarification and standardization on the subject.

Best to all.
Ron

Also attached a copy of my worksheet for resolution that I have inserted columns for line pairs.
 

Attachments

  • level rod.jpg
    level rod.jpg
    19.6 KB · Views: 136
  • Stadia m.jpg
    Stadia m.jpg
    20.1 KB · Views: 159
  • Resolution Sample.jpg
    Resolution Sample.jpg
    129.5 KB · Views: 159
Please clarify the difference between l/mm and lp/mm.

Here's how it seems like it ought to work,to a patently naive mind (mine!) assuming the width of a line and of a space between the lines is the same.

1 line per mm. This seems simple. Every mm there's a line. You could place a mm scale on the pattern so that each mm mark lined up exactly with the center of a line. The width of a line, or a space, is 1/2 mm.

1 line PAIR per mm. This seems tricky. Within every mm of space, two complete lines, and the space between them, exactly fits. This means that the width of the lines and the space is 1/3 mm apiece. So, the separation between line centers in this case would be 2/3 mm.

A multiplicative factor of 2/3 would then convert a resolution value stated in lp/mm to l/mm. Say it ain't so, somebody. Oh, how I hope it's really a factor of 1/2!
Ronh
 
Ronh;
A line per mm would be one black line 1mm wide or one white line 1 mm wide. A line pair is one black and one white line that are ½ mm each and 1 mm total width, also measured from the center of a black line to the center of the next black line, also called a cycle. 1 lp/mm= 2 l/mm.

I have attached a home made USAF chart with a table to look at.

Best
Ron
 

Attachments

  • USAF Color.pdf
    389.2 KB · Views: 121
Unfortunately, much of Wikipedia is oriented to digital technology, written by sincere people, no doubt, but in this case not vetted in optical theory and its conventions. In my opinion, when used as a primary source of knowledge, Wikipedia can be very misleading and can sometimes do more harm than good. The quality of the articles is quite variable, and as an aggregate doesn't substitute for a good text.

Ed

It's not meant to substitute for a good text. It's meant to be a good encyclopedia. There's a difference. And often it's better than nothing.

It can be variable. But it only gets better as people contribute and you don't have to contribute much (stone soup does work).

BTW, a physics prof friend of mind realized there were many articles on the various Surface Science technologies and techniques so in teaching a course she got each of the students to pick one and write the wikipedia article. It was a start!
 
Ron,
Thank you very much. So the rules are 1) both black and white stripes count as lines, and 2) measurements are of period, for example, center to center.

In Konrad's paper, the binocular whose prism has the best glass, and the chosen single layer coating, has a contrast at 40 lp/mm that has fallen to 25% of maximum. Now, I know that 40 lp/mm means that black stripes are centered 1/20 mm apart.

In the f/4, 8x42 that I assumed earlier, 1/20 mm in focal plane, viewed through a 21mm eyepiece, gives black stripes separated by 8 arcmin. That's four stripes across the moon to the naked eye, is all. This separation is easy to see, and and degradation in contrast to 1/4 that of the object sounds really bad.

The link of post #14 (3/4 down the page) shows that this frequency, which is 7.5 cycles per degree, is in fact at the very peak of the eye's performance. If the contrast was suffering badly at this frequency, it should be obvious at a glance.

Henry has made two reasonable arguments that there may be no inconsistency between the plots in the paper and visual experience. One, the binocular and prism both would perform better if the beam were stopped down by daytime pupil of the eye. True enough. But, I'm often out in dusk conditions when my eye must be open to 4-5mm (my eyes open to 6+mm maximum), surely getting a majority of the 8x42's beam, and my binocular still seems to be working very well. Two, the paper is not upfront about the objective lens. But it does say 42mm is the maximum for the Schmidt-Pechan, and what they had laying around was Swarovski binocular objectives. If this hunch is correct, the degree of the mystery does depend on the choice of objective, but not critically.

Sorry for the rant. I can't blame anybody for not wanting to wade through such a thicket. But, I still cannot reconcile the plots with visual experience.
Ron
 
I 'm not sure I want to get too far into this, but I can offer some measurements that suggest there can be much better resolution at the focal plane of a good roof prism binocular than 40 lp/mm. The best 42mm binocular I've measured with the USAF chart (Zeiss 8x42 FL at 64x) has resolution of about 3 arc seconds, close to diffraction limited. I can only see about 11-12 arcsec looking directly through this binocular at 8x, so it's resolution is about 4 times better than my eyesight. Math is not my strong suit, but working Ron's method backwards, the resolution of this binocular would appear to represent something close to 400 lp/mm at the objective focal plane, which would be about right for a nearly diffraction limited f/4 objective. Someone check my math, please!

The Swarovski objective lens in the test might have been 30mm. The 8x30/7x30 SLC and an 8x20 were the only roof prism binoculars Swarovski made in 1991.
 
Last edited:
Ronh;
I think your first calculations were right. 40 lp/mm = 1/40 mm=0.025 mm lp or 80 lines/mm=1/80mm=0.0125mm/line.

Henry is correct, diffraction limited would be about 2.8 or 450 lp/mm, 3" would be around 409 lp/mm. This is one of the reasons I assumed the target was distant on the object side of the objective.

Ron

Look at group 5 element 3, 40.3 lp/mm
 
Last edited:
Please clarify the difference between l/mm and lp/mm.

Here's how it seems like it ought to work,to a patently naive mind (mine!) assuming the width of a line and of a space between the lines is the same.

1 line per mm. This seems simple. Every mm there's a line. You could place a mm scale on the pattern so that each mm mark lined up exactly with the center of a line. The width of a line, or a space, is 1/2 mm.

1 line PAIR per mm. This seems tricky. Within every mm of space, two complete lines, and the space between them, exactly fits. This means that the width of the lines and the space is 1/3 mm apiece. So, the separation between line centers in this case would be 2/3 mm.

A multiplicative factor of 2/3 would then convert a resolution value stated in lp/mm to l/mm. Say it ain't so, somebody. Oh, how I hope it's really a factor of 1/2!
Ronh
ronh is offline Report Post

Ronh;
A line per mm would be one black line 1mm wide or one white line 1 mm wide. A line pair is one black and one white line that are ½ mm each and 1 mm total width, also measured from the center of a black line to the center of the next black line, also called a cycle. 1 lp/mm= 2 l/mm.

I have attached a home made USAF chart with a table to look at.

Best
Ron

The problem, I think, is that it's easy to confuse several very different conceptual frameworks. The concept of a modulation transfer function is mathematical, and relies on the method of Fourier analysis. This was developed to decompose time series into component frequencies. For example, the vibrations of a guitar string, or the frequencies that constitute light.

When this method is applied to the space dimension (i.e., not time) we talk about "spatial frequency." In this framework, an image is conceptualized as a collection of dark-light alternations (frequencies), where contrast plays the role of amplitude. In temporal analysis, a frequency is the number of cycles per unit time, e.g., a guitar string vibrates so many times a second, so we have cycles/sec or Hz. In the case of spatial analysis the unit is a mm, so the spatial frequency is the number of cycles per unit space, e.g., cycles/mm. Since each pair of dark and light lines on a uniform grid represents one cycle, the metric is referred to as lp/mm. However, the number of "line pairs," or cycles, is the same as the number of dark lines, so this is often abbreviated as "lines" per mm. In the field of optics they mean the same thing — namely, the number of cycles per mm. I might add that phase can be altered by offsetting the spatial grid left or right, but that's not often of interest. A cycle can begin anywhere one wishes, but unless phase angle is a consideration its easiest to think of a cycle beginning with the edge of a dark line, i.e., zero phase angle. Again, it's a matter of convention.

There are many allied fields such as television, digital displays, analog/digital photography, surveying, vision science, optometry, etc. which use similar spatial grids for measurements but have adopted different naming conventions. These, as we see, often come into conflict. Arguing about which is right or wrong, however, is largely a waste of time. It's a matter of the context in which the terms are used. Trying to shape an optician to talk like a psychologist, for example, is futile — and since there are more of them on BF than there are of me, I adapt. Still it does grate on one's nerves to realize that an "optical illusion" is infrequently understood to be what it is, — namely, a mis-perception! But, ... I wander. :-O

Ed
 
Last edited:
Elkcub,
If you are a psychologist, great, we need help bad. And, you talk very like an optician, if that's a compliment. But, the factor of two quandry resulting from lines vs line pairs does not begin to absorb the magnitude of my misunderstanding, which is more like a factor of ten.

Ron and Henry,
40 lp/mm in the focal plane of the objective should indeed be a piece of cake for a good binocular. According to the plot, 40 lp/mm is certainly being "resolved"-- I guess resolution could occur down to much lower than 25% of object contrast, maybe less than 5% in an almost-greyed out view. But the plotted bino seems to be running out of contrast gas mighty fast with increasing image frequency. If the plot were extrapolated, 5% contrast would fall somewhere around 60 lp/mm.

So, thank you for your work, and maybe you see my problem. Binoculars are better than that! I am confident that I am simply misunderstanding something, but can't figure out what it is.
Ron
 
Ronh;

Ed is correct. When resolution is being discussed in terms of line pairs, only one color bar is counted. I have attached a jpg of the ISO description of a bar, a line in our jargon. ISO uses a negative target so their primary bar is the bright bar.

I do not have a problem with the line pair’s concept; it is far easier to measure by automated analysis means than other methods. I was just pointing out, that in surveying and engineering, both the black and white widths contain sub dividable information that are identified and measured separately, so they have to be resolved and counted individually.

I hope the following will make sense and help you, but may confuse the issue even more. The real image formed by the objective train has to have an object to image. If we assume that the 168 mm is the focal length then it is easy to assume the objective was focused on a 1 mm object 1680 mm in front of it (about the size of the cluster containing group 4 and 5). The resulting real image would be .111mm so the 40 lp/mm would be compressed to 360 lp/mm at the focal point and your assessment of 60 lp/mm is in line with the perfect MTF curve. The lens and prism are probably not perfect so the 400-420 lp/mm seem like a reasonable extinction value. These numbers seem consistent with what one would expect from a good 42 mm objective.

Since the text stated that the MTF curves were in general agreement with the (and not generated by the) interferograms, I assume (maybe a very bad assumption) that the MTF were done by the generally accepted method of using a target of a sine wave pattern or, more common, a standard bar pattern target.

I will leave it at that and not get into the Ronchi test (I am not qualified) were the grating is inserted at the focal plane since, as far as I am concerned, that test is more about aberrations than resolution and contrast. For more information about choosing the grating and relay lens dimensions see http://www.mmresearch.com/articles/article1/index.htm

In my own opinion and from what I have seen, small enclosed telescopes and binoculars and other optics that have a generally inaccessible real image are defined by the resolution of an object where photographic optics have either film or a sensor that capture the real image and can be analyzed separately.

Have a good day.
Ron
 

Attachments

  • ISO bars.jpg
    ISO bars.jpg
    63.7 KB · Views: 95
Last edited:
Ron,

For me, the issue is resolved, and I hope for ronh. ;)

Thanks for the excellent explanation, url, and resolution target.

Ed
 
Last edited:
Ron,
Thank you so much for trying to help me. I believe you have argued, and correctly, that a 40 lp/mm target, 1.68 meters from an 8x42 telescope (assuming it could focus this close), would challenge the instrument with its 360 lp/mm in the focal plane. 540 lp/mm in the focal plane is the MTF extinction frequency, or "resolution" of the telescope if it were perfect. I follow your math, and that was a useful exercise.

Now, if I can sort of guess what you're thinking but did not quite say, it seems reasonable that this challenge frequency might fall on the MTF curve down around the 25% of maximum contrast level, shown in the paper for "40 lp/mm" in the plot of best prism glass and best coating.

Yet I am still puzzled. My simple assumption that by "40 lp/mm" they mean "in the focal plane" cannot be correct, because good binoculars are not down in contrast appreciably at such a low frequency. But, what bothers me about what you did is the rather strange 1.68 meter distance required to reach the desired conclusion. That's not an industry standard, is it? It sounds like you cooked it up to make 40 lp/mm in the object plane do what you wanted it to do. Still it works, I have to admit. If the authors of the paper were photographing the image plane, they would not have been limited by a binocular's focusing ability--they'd have had just the objective and prism out on the table, so could have certainly focused at 1.68 meters if they wanted to. It is, in fact, a convenient distance for a bench test. But without stating it explicitly, they have avoided telling us anything about the absolute performance of the system they measured, so the plots are reduced to unnormalized, relative, touchy-feely type information.

So, maybe you have figured out what they did! 1.68 meters, and 40 lp/mm in the object plane! Would you agree that they didn't SAY what they meant, and that it wasn't obvious?
Ron
 
Ronh;

I guess I should explain some points that I use that influenced my assumptions.

In the lab, a lot of times it is easier on the math to use multiples of the focal length to keep the math simple to double check the results in my head instead of waiting to the end of a test and then figuring out something was set wrong. 168 x 10=1680.

In my attachments of the tables I showed, I just showed the normal distance calculations. I have a page for my collimator calculations. You can put the bar target in a collimator and adjust the math for whatever ratio you wish, place the collimator lens right up against the objective under test, and the bino will focus at infinity. This way you are making the measurements at the design infinity setting even though the target may only be 100 or 200 mm from the objective.

I have attached a picture of my USAF target in the collimator, 400 mm from the camera lens focused at infinity. Group 5, element 3 is 40 lp/mm.

Now the harder one. I have attached the second page of my resolution sheet. My primary collimator for resolution work has a 400 mm focal length. If for some reason I want to change to a 1680 mm focal length, I really do not have to change anything. At the end of the sample run, all I have to do is adjust the reading by a factor arrived at using the desired focal length divided by the collimator focal length and just correcting by that factor; 1680/400=4.2, I pick a group, element that has 168 lp/mm. (4.2*40). Or, if like me, you have a decent lens kit around, you just take a 0.6 diopter lens and a lens holder and target holder and set up a test set that would have a 1667 mm length, within 1% of 1680. There are many ways to get to the desired results while staying on the tabletop.

Hope I have my numbers correct in this quick run down.
Best.
Ron

Sorry Ronh, I just noticed that in my haste here at the office that I have an error in the spread sheet. The distance information in the first column for distance should read 1.68 instead of .168 and the values for Arcseconds/LP need to be divided by 10 and match the lower set. Now you see why I have to keep it simple. Also, I was just going on your assumption of the 168 mm focal length and 10 times 40 lp/mm=400 seemed resonable as a quick guess for a 42 mm objective. All done by guessing, not by trying to make the numbers fit anything in particular since it was all assumed anyway.
 

Attachments

  • Baigish.jpg
    Baigish.jpg
    55.7 KB · Views: 81
  • Ronh.jpg
    Ronh.jpg
    131.9 KB · Views: 82
Last edited:
Ronh;

Another thought before I retire from this thread. A few years ago I bought a camera software package to try MTF testing for binoculars but had to give up on it because the only way I could capture the image was taking a picture of the image through the eyepiece so I was doing a MTF of the whole binocular plus the camera lens. I could not figure out a way to separate the two systems.

It is far simpler to get the lens aberrations by another source such as star testing, interferograms or other means and calculating the MTF curves. There are computer programs available that once you identify the lens errors you can calculate and generate various reference curves such as MTF, interferograms, 3d wave front plots or regular wave front plots, point spread functions, etc. This is the way I approach the problem now. Still a whole lot to learn though.

In the article we have no way of knowing their a) test setup b) whether they measured existing lens errors or c) introduced known errors and then modeled the result to extrapolate various performance points. I suspect it was a combination of all three since it appears they were trying to evaluate different configurations of the same components.

I could guess all night and probably come up with a dozen scenarios and math that fits their data but in the end, since we do not know their actual conditions, we just have to rely on their description of their results.

Have a good night.
Ron
 
Ron,
What a thorough reply, just when I was afraid you might have given up on me. The use of the collimator is very interesting. And it is fascinating to think that MTFs are actually measurable. If a perfect f/4 optic goes to 560 lp/mm in the focal plane, what fine granularity a CCD array must have to sense the resolving powec, to actually map out not just the peaks and valleys, but a fair representation of a sinusoid! It's all very impressive.

Thanks especially for saying that it wasn't clear from the paper how they made the measurement. That single remark has, perhaps unjustifiably, made me feel a bit less stupid!

This has been a good learning experience. I am not an optics pro. Lord knows, I do not, like you, have a decent lens kit! To you, and the other guys too, I apologize for "hammering" on this issue, perhaps too hard for a web forum, where technical discussions are difficult and should be limited. But I love this stuff.

You have been kind, and are free to go now!
Ronh
 
Ronh;
I am still very much a novice at this stuff too. You may want to look at http://www.imatest.com/docs/index.html for details about the MTF testing. It works well for a single lens system. If you have any specific questions about collimators we can get into that later.

Have a good night.
Ron
 
Warning! This thread is more than 16 years ago old.
It's likely that no further discussion is required, in which case we recommend starting a new thread. If however you feel your response is required you can still do so.

Users who are viewing this thread

Back
Top