• Welcome to BirdForum, the internet's largest birding community with thousands of members from all over the world. The forums are dedicated to wild birds, birding, binoculars and equipment and all that goes with it.

    Please register for an account to take part in the discussions in the forum, post your pictures in the gallery and more.
ZEISS DTI thermal imaging cameras. For more discoveries at night, and during the day.

Interpretation of Frequency Division sonograms. (1 Viewer)

hollis_f

Well-known member
Hi All,

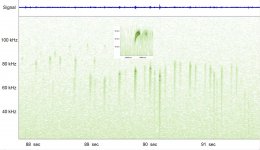
I went out last night on a Bat Walk at WWT Arundel. I was using my new Ciel CDB-305 detector in FD mode, recording the output and running it through BatScan. No Problem.

The problem I'm having is interpreting the sonograms. I've not been able to find example images to compare my own. There's loads of stuff for heterodyne detectors, but not much for FD. Attached is one that I'm having real problems with, I'd be grateful for any help.
 

Attachments

  • BatScan%20Arundel%20.jpg
    BatScan%20Arundel%20.jpg
    118.5 KB · Views: 129
Hello Frank,

The sonogram contains a few clues to the identification of the bat.. Number of pulses per second, frequency range, and duration of signal can be measured from your sonogram.
Probably the most important data is the peak frequency, which can be measured by selecting an individual pulse, and measuring the spectrum analysis, or power spectrum. Not sure how you do this in BatScan. but it looks like the smaller window might have this data.

These values together with any clues to the size and behaviour of the bat, the habitat, and whether it was in the open or clutter can usually narrow it down.

As for your sonogram, I wouldn't like to say. The peak frequencies seem very high ~70KHz-80KHz, which doesn't really equate to anything except, Greater Horseshoe (but the pulse shape is wrong for this species).

The number per second is around 8-9 which would be good for Pipistrelle.. In fact yours look like a Pipistrelle, but upside down.

If you have any other sonograms, of other bats, then feel free to post them here, I'll see if they make any more sense.

I'm not familiar with the model of detector you have.. One other thought could be that you recorded the Heterodyne as opposed to the Frequency Division? Not sure if this is possible or likely. Or I am missing something and others can maybe shed more light.

Peter
 
Hi,
it looks to me that somehow the frequency in your spectrogram /sonogram has flipped upside down. Funny, not quite what i would expect from a FD/zerocrossing detector. You may want to try to make a spectrogram with some other program sucj as audacity or raven light and see what they look like.

HarryJ
 
Warning! This thread is more than 10 years ago old.
It's likely that no further discussion is required, in which case we recommend starting a new thread. If however you feel your response is required you can still do so.

Users who are viewing this thread

Back
Top