JGobeil
Nature Photographer
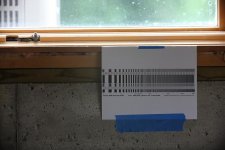
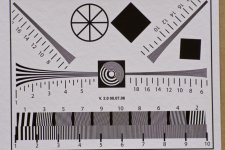
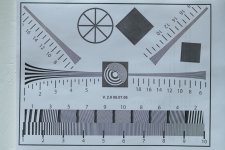
I quite like the chart we have now as it pretty much covers everything that we want to test. All my tests so far have been under 20m which isn't really taxing the scope or any of our scopes so I guess we need to increase the range. I would normally use a 2X converter at around 30m and beyond. Maybe we should get to the point where the test chart fills the frame and then move an additional pre determined distance, say 15 or 20m or maybe find out at what range the current chart starts to fail and use that as a guide.
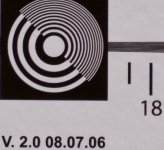
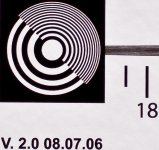
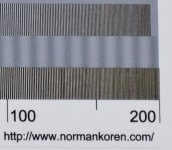
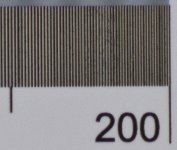
The Koren chart is ok to print and has some very fine lines but for what we want to do it's unsuitable in that the finest lines are way off to one side and it doesn't test all the corners for softness. Plus as we have already shown it's still fairly easy to resolve all the lines at the ranges we are already experimenting at.
edit - comparing the lines on our current chart with the Koren one I'd say our chart is around the 150 range so it's already testing quite fine detail.
Paul.
Very interesting comments Paul. Let's see what the others have to say.
 |
|