


Sy V
Well-known member
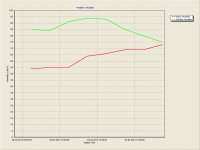
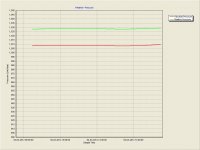
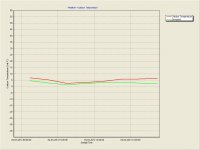
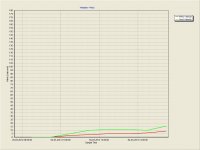
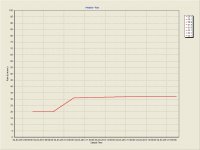
As promised yesterday, but a bit late in coming, here are some simple example line graphs from the few hours that the Weather Station was up and working yesterday (I think some of the data will be better presented by bar charts, but I'll have a play with options over the coming weeks; it's all part of the learning curve). The data logger's generating a datum point every hour which I think will best suit our needs. Remember it hasn't had much data to go on yet (and some of the early reading maybe a little spurious as the gubbins was either in the Landie, lying in the grass or in the hide. I'll have to do some work on the axes to make these more legible too and I'll try to set things up so that the datum points fall on the hour and not at 27 minutes past!
Attachments
Last edited:
")