opisska
rabid twitcher

I realize that I could have probably asked the Tarsiger people to give me a database dump, but to be honest, this was far more fun  I have made a simple set of BASH tools to download and parse the entire Tarsiger WP news history (all of the 710 pages of it, dating, amusingly, back to 1655 and no that 6 is not a typo), so I could convert it into data to play with. As the pages are obviously automatically created from a database, the parsing is straightforward, barring a few odd, mostly very old records, so I was able to get over 36000 data entries with date, species and country. Since the data clearly belongs to Tarsiger, I am not going to post the resulting data file (but I am willing to share it privately), but I would like to enlighten you with some insights that can be extracted from the data, because with that many data points, the possibilities are endless!
The entire archive has 890 species, including things that are almost funnily common in Europe (like Blue Tit), just found in very unusual corners of WP. I have created a subset that I call "our targets" where I removed everything I already have on a WP list + species that we are reasonably expecting to see in their breeding ranges in WP once we actually go there, if this is an area I deem accessible (so basically anything but Russia).
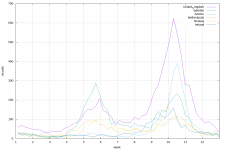
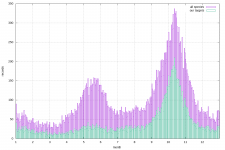
So far I made two plots of interest - the first just shows the distribution of dates of records for all species and for the selected ones. You can see that roughly October 10 is the peak date and also that the spring peak is quite suppressed in "our targets" - a cursory overview shows that this is probably due to a much higher fraction spring records being eastern WP species in western Europe and we have seen many of those species in their home WP ranges or in central Europe.
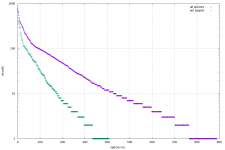
In the second plot, I show the species ordered by the number of records, with a logarithmic y-scale for better readability. You can see that the distribution follows a broken exponential - the few very common vagrants are really common and then there is a long tail of very rare birds.
The 10 most reported species in the dataset and their number of observations are:
787 Pectoral_Sandpiper
713 Olive-backed_Pipit
664 Buff-breasted_Sandpiper
643 Dusky_Warbler
626 Orange-flanked_Bush_Robin_(Red-flanked_Bluetail)
552 White-rumped_Sandpiper
481 Lesser_Yellowlegs
467 Hume's_Leaf_Warbler
432 Red-eyed_Vireo
418 Ring-billed_Gull
The 10 species we most need are:
713 Olive-backed_Pipit
552 White-rumped_Sandpiper
432 Red-eyed_Vireo
401 American_Golden_Plover
390 Radde's_Warbler
361 Baird's_Sandpiper
352 Long-billed_Dowitcher
351 Semipalmated_Sandpiper
307 Laughing_Gull
300 Pacific_Golden_Plover
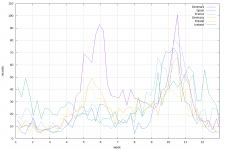
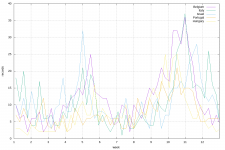
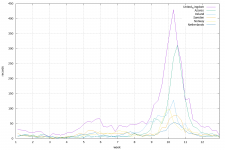
I am planning ultimatelly to do the time plot but country by country to see what are a good destination for which part of the year, but that will require some more playing with the data.
-------------------------------------------------------------
Below are some of my simple codes, if someone wants to do something similar and spare the effort. This is gonna make sense only for people who know BASH obviously (so I hid it in qoute not to scare anyone else). I find BASH to be typically the path of least effort to do text parsing and it has proven correct in this case.
The entire archive has 890 species, including things that are almost funnily common in Europe (like Blue Tit), just found in very unusual corners of WP. I have created a subset that I call "our targets" where I removed everything I already have on a WP list + species that we are reasonably expecting to see in their breeding ranges in WP once we actually go there, if this is an area I deem accessible (so basically anything but Russia).
So far I made two plots of interest - the first just shows the distribution of dates of records for all species and for the selected ones. You can see that roughly October 10 is the peak date and also that the spring peak is quite suppressed in "our targets" - a cursory overview shows that this is probably due to a much higher fraction spring records being eastern WP species in western Europe and we have seen many of those species in their home WP ranges or in central Europe.

In the second plot, I show the species ordered by the number of records, with a logarithmic y-scale for better readability. You can see that the distribution follows a broken exponential - the few very common vagrants are really common and then there is a long tail of very rare birds.

The 10 most reported species in the dataset and their number of observations are:
787 Pectoral_Sandpiper
713 Olive-backed_Pipit
664 Buff-breasted_Sandpiper
643 Dusky_Warbler
626 Orange-flanked_Bush_Robin_(Red-flanked_Bluetail)
552 White-rumped_Sandpiper
481 Lesser_Yellowlegs
467 Hume's_Leaf_Warbler
432 Red-eyed_Vireo
418 Ring-billed_Gull
The 10 species we most need are:
713 Olive-backed_Pipit
552 White-rumped_Sandpiper
432 Red-eyed_Vireo
401 American_Golden_Plover
390 Radde's_Warbler
361 Baird's_Sandpiper
352 Long-billed_Dowitcher
351 Semipalmated_Sandpiper
307 Laughing_Gull
300 Pacific_Golden_Plover
I am planning ultimatelly to do the time plot but country by country to see what are a good destination for which part of the year, but that will require some more playing with the data.
-------------------------------------------------------------
Below are some of my simple codes, if someone wants to do something similar and spare the effort. This is gonna make sense only for people who know BASH obviously (so I hid it in qoute not to scare anyone else). I find BASH to be typically the path of least effort to do text parsing and it has proven correct in this case.
First to download the pages, I just use wget and set the page limit by hand to what it is now
for i in $(seq 0 710)
do
  wget -O $i.html "http://www.tarsiger.com/news/index.php?p=news&sp=wp&lang=eng&place=&country=&species=&day=&month=&year=&p_nr=$i"
done
Then the main magic happens in a script I, being the master of puns, named parsiger.sh (which needs to be run for all files previous downloaded)
export LC_ALL=C ndate=false cat $1 | while read line do if [ "$ndate" = true ]; then ndate=false if [[ ! ${line::1} == "<" ]]; then adate=$(echo $line | cut -d"<" -f1) fi fi if [[ "$line" =~ .*"class=news_date".* ]]; then ndate=true fi if [[ "$line" =~ .*"news_species".* ]]; then atmp=$(echo $line | sed -e "s/.*news_species.*'>//" | sed -e "s/´/'/") aspecies=$(echo $atmp | cut -d, -f1) alatin=$(echo $atmp | cut -d">" -f2 | cut -d"<" -f1) fi if [[ "$line" =~ .*"news_country_links".* ]]; then acountry=$(echo $line | sed -e "s/.*news_country_links.*'>//" | cut -d'<' -f1) echo -e "$adate\t$aspecies\t$alatin\t$acountry" fi done
Finally, there is super trivial code to turn the weird dates into days in year:
 cat $1 | while read d1 d2 d3 d4 rest
do
   d3b=$(echo $d3 | sed -e "s/[a-z]//g")
   d5=$(echo "$d2 $d3b $d4")
   d6=$(date -d "$d5" +%j)
   echo -e "$d4\t$d6\t$rest"
done
To sort out the species, I expand the datafile into individual files for each species, simply using filesystem as the world's most convenient database:
rm species/*
cat $1 | tr '\t' ';' | while read line
do
  specie=$(echo $line | cut -f 3 -d';' | tr ' ' '_')
  echo $line>>species/$specie
done
And then I just cat everything back in one file and plot with GNUPLOT:
set term png size 1200,800
set output 'hist-all.png'
set xrange [1:12.99]
set xtics 1
set grid
set xlabel 'month'
set ylabel 'records'
plot 'parsiger-all-days.csv' u ($2/30.5+1.0):(1) smooth frequency with boxes title "all species" , 'parsiger-nase-days.csv' u ($2/30.5+1.0):(1) smooth frequency with boxes title "our targets"
set output 'species.png'
set xrange [*:*]
set logscale y
set xtics auto
set xlabel 'species no.'
plot 'species.csv' u 0:1 title "all species",  'species-nase.csv' u 0:1 title "out targets"


