Birdspotter
Well-known member
Hi
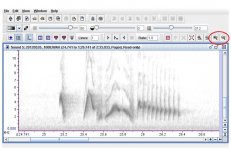
Can anyone tell me how to reduce the height of the sound frequency on a sonagram.
I use Audacity to cut out the white noise backgound as well as the length of the recording ect before opening up the file in Raven Lite 1 to make the sonagram.
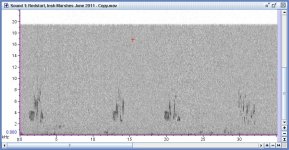
I can make the sonagram no problem it's just reducing the frequency that I have a problem with! For example I have this recording of a redstart which reaches a pitch of 8KHz but my graph is telling me the height of the actual sonagram is 20KHz. I want to reduce this to ten, thus giving me a better and easier sonagram to read.
Thanks in advance
Calum.
Can anyone tell me how to reduce the height of the sound frequency on a sonagram.
I use Audacity to cut out the white noise backgound as well as the length of the recording ect before opening up the file in Raven Lite 1 to make the sonagram.
I can make the sonagram no problem it's just reducing the frequency that I have a problem with! For example I have this recording of a redstart which reaches a pitch of 8KHz but my graph is telling me the height of the actual sonagram is 20KHz. I want to reduce this to ten, thus giving me a better and easier sonagram to read.
Thanks in advance
Calum.
Attachments
Last edited: