• Welcome to BirdForum, the internet's largest birding community with thousands of members from all over the world. The forums are dedicated to wild birds, birding, binoculars and equipment and all that goes with it.

    Please register for an account to take part in the discussions in the forum, post your pictures in the gallery and more.
ZEISS DTI thermal imaging cameras. For more discoveries at night, and during the day.

Can a small bino really deliver? (3 Viewers)

Hello Henry;

Last night I did a little checking to refresh my memory. I use a different procedure than you since I do not like to modify the lateral and longitudinal magnifications or f ratio. The setup I used was a resolution target collimator, the binocular (8x42 Promaster, reviewed on BF before), an adjustable iris then the camera/booster/eye as a detector.

The results are essentially the same as yours. The measurements are shown below.

Using my eye as a detector with a 6x booster, the resolution (right tube only checked) for full exit pupil, about 5.2 mm, was group 7 element 2 or 3, about 3.4”. Setting the iris to ~2.5 mm the resolution was about group 6 element 3 or 4, about 6”.

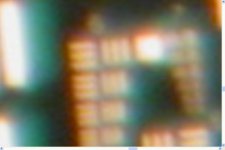
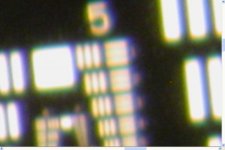
I first tried using the camera but the power was insufficient for getting to limiting resolution and neither manual focus or auto focus worked well enough to suit me. The crops are attached. I called these group 6-1=8” at full exit pupil and group 5-1 or 2=14” at 2.5 mm. May be a problem with the edge of stop interfering, notice difference between horizontal and vertical focus at 2.5 mm exit pupil.

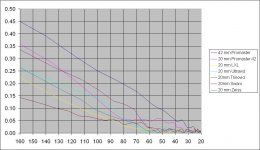
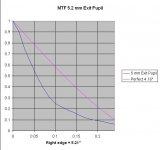
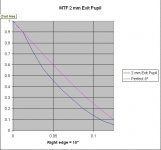
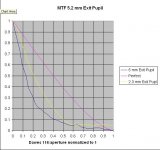
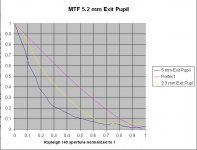
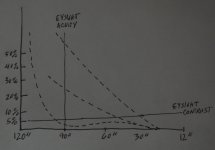
Next, I set up a quick MTF measurement. This was done sloppily since I was only interested in the difference between two exit pupils and not in absolute values. As can be seen from the attached plots the 5 mm exit pupil pretty much matches my star test results some time ago. The curve indicates roughly 0.4 wave of error with an extinction resolution about 4”, 6% contrast at 5.2” and 50% contrast at 22.2”. The 2 mm plot indicates approximately a little less than a quarter wave error with extinction around 8”, 6% contrast at 10.25” and 50% contrast at 27”.

I have spent more time making the post than doing the measurements.

Thought this might interest you.


To All;

I still mostly use 8x20’s, mainly because they are always with me. Most of my larger objective binos give me better images but they are inconvenient to have on hand at all times.
 

Attachments

  • 5mm plus.jpg
    5mm plus.jpg
    41.6 KB · Views: 91
  • 2mm plus.jpg
    2mm plus.jpg
    54.2 KB · Views: 87
  • MTF 5.jpg
    MTF 5.jpg
    31.9 KB · Views: 112
  • MTF 2.jpg
    MTF 2.jpg
    32.4 KB · Views: 111
Henry, Ron,

I'm happy to be proven wrong when that involves learning more. However, I cannot help but wonder (and here you can set me straight again) if the MTF behavior of the two apertures Ron tested may not hint at a possible reason why the exit pupil needs to be a bit bigger than 2.5mm for me to imagine that my eyes can resolve all they could. I'll quote Ron's post above here:

"The [5.2mm] curve indicates roughly 0.4 wave of error with an extinction resolution about 4”, 6% contrast at 5.2” and 50% contrast at 22.2”. The 2 mm plot indicates approximately a little less than a quarter wave error with extinction around 8”, 6% contrast at 10.25” and 50% contrast at 27”.

Perhaps the difference I (we) see is not due to the extinction resolution differences, but to significant enough contrast differences at spatial frequencies 1.5-4 or so times the maximum acuity of our eyes?

Kimmo
 
Ron and Kimmo,

Accurate MTF's of binocular optics would be a big step forward in really understanding things. I'd love to see Ron do these for more models.

I would like to see at least two curves similar to what Ron has done here: a full aperture MTF and an MTF with a stopped down aperture to maybe a 2,5 or 3mm exit pupil that stands in for daylight use. If both are plotted on the same spacial frequency scale then eyesight acuity would be located at the same place on the scale for both curves.

Kimmo, one thing to consider in this case is that the 5.2mm MTF is only relevant when the eye is open wide enough to accept it. If the eye's pupil is 2.5mm then the 2.5mm MTF is what you're stuck with no matter how large the objective lens. Then there is the factor of poor eyesight acuity at 5.2mm dilation to further muddy the picture.

Ron, is the 2mm exit pupil MTF mislabeled? Should it be 2.5mm?

Henry
 
Last edited:
Ron and Kimmo,

I would like to see at least two curves similar to what Ron has done here: a full aperture MTF and an MTF with a stopped down aperture to maybe a 2,5 or 3mm exit pupil that stands in for daylight use. If both are plotted on the same spacial frequency scale then eyesight acuity would be located at the same place on the scale for both curves.

Henry

Henry, if the aperture is stopped down to create a 2.5mm exit pupil, that would seem to make the comparison "unfair" to an actual 8x20. That is, stopping down a large binocular's aperture to 20mm would just make another 8x20. ? Or is that not what would happen because you're now using the center of the glass and desiring to measure just the center's possibly improved optical qualities?

I was thinking that, to help determine whether or not an 8x20 or 8x25 can "see less" than one of larger aperture, the ideal would be to somehow stop down the eyepiece (of the large objective unit) instead. That way, you take advantage of the full aperture's resolution -- if the theory of "bigger is better" holds correctly. ?

Howard
 
Howard is right on. If stopping down made a compact, Henry would not have to tote a 56mm. In daylight with 2.5mm eye pupils, only about 20 mm of the 56mm gets used.

Now, if RonE would just do an MTF on a high class 20mm compact, full aperture.
And if Henry would go look through one.
RonH
 
I'm not trying to help the little squirts. I'm just thinking of how to generate MTF's that accurately represent any binocular's performance in daylight when the effective exit pupil size is limited by an eye with a small entrance pupil.

Henry
 
Last edited:
RonH;

Attached are some of my pocket bins. These are a couple of years old, later part of 2008 I believe.

I have since abandoned the method used and refined the technique considerably, so these really need to be redone, but should give you an idea. Don’t place too much stock in the ranking, sample variation can place them anywhere compared to another. My best guess from what I have seen is that if you had a large sample of each brand, the average would probably be very close to the same. Sample variation seems to be larger than design factors to me.

Henry;

Yes, mislabeled. I originally tried to get iris to 2 mm but spring tension kept creeping a little. Best guess at actual aperture is 2.3 or 2.4 mm but I did not have the optical micrometer handy, so just guesstimated with a circle template. Like I said, done in a hurry for comparative purposes. Went back and changed most of the 2mm references but forgot graph. My minimum pupil diameter is about 2.25 mm.

I can easily put all the curves on one graph but not sure exactly what you would like. Probably put all on one graph with a curve and diffraction line for each resolution?
 

Attachments

  • Pocket Bins Average 1.jpg
    Pocket Bins Average 1.jpg
    76.1 KB · Views: 126
  • Pocket Bins Average 2.jpg
    Pocket Bins Average 2.jpg
    63.2 KB · Views: 109
.................Perhaps the difference I (we) see is not due to the extinction resolution differences, but to significant enough contrast differences at spatial frequencies 1.5-4 or so times the maximum acuity of our eyes?

Kimmo

Kimmo;

I came to a conclusion a long time ago that line separation alone is not enough to determine resolution. If we had 2 lines separated by 1 arc second with only 6% contrast, we would probably see a blob. If we had the same 1 second separation but with 100% contrast, we still might not be able to make out the edges, but would probably see a lighter or darker center compared to the edges and, after all, the standard for resolving the lines is just to be able to discern the direction of the lines. The same would apply to other shapes, stars.

Look at some of the bars in the photo crops above, a lot of them you can not detect any edges but you can detect a difference in intensity and determine the direction.

I think this is a large factor in the “brightness” of larger objective. The glass resolution, the fact that you have lesser aberrations, reduced vignetting, longer focal lengths, eye placement, etc. all are contusive to the contrast building faster as the spatial frequencies reduce.
 
Last edited:
RonE,
You are awesome, and a good sport.

It is interesting that stopping down the 42mm made the MTF get worse. This behavior seems opposite to Henry's contention regarding a big binocular in the daytime. I suppose it depends on the degree of aberrations and flaws in the outer parts of the optics. (Granted, some of Henry's reasoning concerns not pure image quality, but scattered light and viewing comfort, and that would be impossible to quantify.)

Also, as you open the aperture up and get closer to those bad things happening at the edge, the theoretical resolving power improves. The tug of war's outcome may not always be predictable.

Unfortunately, I can't quite compare the MTFs of the compacts to that of the 42mm, because the horizontal axes are labeled differently. Could you please explain the units or at least give us a conversion factor so we can relate your recent measurements to your previous ones?
thanks
Ron
 
...........Could you please explain the units or at least give us a conversion factor so we can relate your recent measurements to your previous ones?
thanks
Ron

RonH;

I will have to dig through my records for the CCD dimensions used on those measurements if wanted, but the units are straight forward and proportional. The right edge is 8” @ about 52 lp/mm. To get to any angular value, proportion the angle to the x units. For example 52=8 so at 25 it would be 52/25*8=16.6” or at 45, the 52/45*8=9.25”.

The more recent plots were done with a different CCD and focal length setup but the above proportion still works, halfway across is 2x the right edge value, one quarter across is 4 times the right edge value. The numbers on the x axis are cycles per pixel so the reciprocal of that would be pixels per cycle. Example 0.1 = 0.1 cycles/pixel or 10 pixels per cycle. The CCD has approx. 291 pixels/mm and the focal length of the collimating lens is 71.2 mm or about 9.96” per pixel. So each line pair on the CCD ~ 20”. Do not forget to divide by bino power, so at 8x each line pair (2 pixels) would be 2.5”

On the stopped down MTF, the MTF is better, as evidenced by the curve being located closer to the diffraction limited line, or perfect calculated line for a given aperture. It is all relative to the aperture and Dawes estimate for that circular aperture. You will notice that the diffraction line plotted is the same for all percentage points (if they were plotted with the end of diffraction line exactly on the right grid edge at the extinction angle). I did not do that, but it makes no difference as the angles are related. You will notice that the same percentage of x value yields the same percentage of contrast. If the right edge of the grid is made for x value = 100% then the following x values would yield the indicated y values for diffraction limited optics;

X y
0 1
0.03 0.96
0.06 0.93
0.07 0.92
0.08 0.9
0.1 0.88
0.13 0.84
0.17 0.8
0.18 0.77
0.2 0.75
0.23 0.72
0.25 0.7
0.28 0.66
0.3 0.63
0.32 0.61
0.33 0.6
0.37 0.55
0.4 0.52
0.41 0.5
0.46 0.45
0.5 0.41
0.52 0.39
0.55 0.35
0.57 0.33
0.59 0.31
0.62 0.28
0.65 0.25
0.69 0.21
0.72 0.18
0.76 0.15
0.79 0.13
0.8 0.12
0.83 0.1
0.86 0.08
0.88 0.06
0.9 0.05
0.93 0.03
0.94 0.03
0.97 0.02
0.98 0.01
1 0.01


Note: RonH, I made the right edge equal to the calculated 6% contrast point.
 
Last edited:
Ron,
I hope I can figure that out tomorrow, and sure appreciate your explaining it.

Regarding your measured MTFs of the 42mm at full aperture and stopped down. The stopped down MTF is indeed closer to the theoretical value for its aperture, than the 42mm MTF is to its ideal. But if you will just plot those two measured MTFs on the same page, you will see that the stopped down curve lies beneath the full aperture one. I believe this means the binocular transmits more information at full aperture.

Yes the stopped down case is more nearly "perfect". But as many users of large reflecting telescopes know, a big mediocre mirror beats a small perfect lens, because its entire diffraction pattern, although screwed up, fits neatly inside the Airy disc of the little telescope. I suspect something like that may be going on here.
Ron
 
Henry, Ron,

This is a very good discussion indeed.

Henry,

As a comment to: [Quote, Henry]

"I would like to see at least two curves similar to what Ron has done here: a full aperture MTF and an MTF with a stopped down aperture to maybe a 2,5 or 3mm exit pupil that stands in for daylight use. If both are plotted on the same spacial frequency scale then eyesight acuity would be located at the same place on the scale for both curves."

I sort of "read between the graphs," but as we now know that the actual exit pupil Ron used for the stopped-down graph was more like 2.3-2.4mm, he pretty much did just as you suggest except for plotting both on the same graph. My guess is that before I have this posted, he has done that too.

And on this: [Quote, Henry]

"Kimmo, one thing to consider in this case is that the 5.2mm MTF is only relevant when the eye is open wide enough to accept it. If the eye's pupil is 2.5mm then the 2.5mm MTF is what you're stuck with no matter how large the objective lens. Then there is the factor of poor eyesight acuity at 5.2mm dilation to further muddy the picture."

As I said, I was "reading between the graphs." I also agree that the picture is plenty muddy enough, and I know that my eyes are not resolving at their best when dilated to a 5mm pupil. But I think it is fair to speculate just from these two graphs that at the pupils we view with much of the time (at least here in the north, light levels are often enough such that our eyes are not at their minimum pupil diameter), the resolution/contrast of the image served by binoculars which are always stopped down to exit pupils no bigger than 2.5mm puts a constraint on our ability to extract information from the image - including information such as the orientation of a grating acuity chart. In Ron's example, the 6% contrast limit of the 2.4mm exit pupil is already worse than my visual acuity when I'm viewing a brightly lit test target, and the 50% contrast limits are reached at ca. 2.5x (for the small exit pupil) and 3.1x (for the full exit pupil) of my acuity limit. Of course, comparison to the full exit pupil situation exaggerates the difference, and the relevant area is probably to be found somewhere in between. I will try to do some visual tests over the holiday break with my scope and aperture masks to see whether I can convince myself that a 2.5mm exit pupil is enough for me.

Ron,

This response from you I think sums it up really well and I agree completely.

[quote, RonE]
"I came to a conclusion a long time ago that line separation alone is not enough to determine resolution. If we had 2 lines separated by 1 arc second with only 6% contrast, we would probably see a blob. If we had the same 1 second separation but with 100% contrast, we still might not be able to make out the edges, but would probably see a lighter or darker center compared to the edges and, after all, the standard for resolving the lines is just to be able to discern the direction of the lines. The same would apply to other shapes, stars.

Look at some of the bars in the photo crops above, a lot of them you can not detect any edges but you can detect a difference in intensity and determine the direction.

I think this is a large factor in the “brightness” of larger objective. The glass resolution, the fact that you have lesser aberrations, reduced vignetting, longer focal lengths, eye placement, etc. all are contusive to the contrast building faster as the spatial frequencies reduce."

Kimmo
 
Can a small binocular deliver, yes it can. Leupold 6x30 Yosemite.

As a side note to the very detailed technical and perceptual discussions going on in this thread, you are getting back to the basics, it seems. That is, what are small binoculars. Personally, I think Leupold 6x30 models are far from being small. They are mid sized like all x30 or x32 models. Part of the fact that they seem to deliver so well is that they only have a 6x magnification. It's like comparing youtube videos in their original size or enlarged. The small original screen gives the feeling of a "sharper" picture.
 
Henry;

I think one of these forms may be what you are looking for. If not, let me know and I will see if I can do it.

The Dawes limit is what you typically see in most astro books, like your Telescope Optics. I, personally, find the Rayleigh criterion a better fit for typical binocular optics. I have never had a binocular get close to the Dawes limit (though astro instruments of quality routinely surpass Dawes), but have had very high quality, low aberration instruments closely approach or reach the Rayleigh limit.

For those interested in a brief review of Dawes/Rayleigh, see http://www.licha.de/astro_article_mtf_telescope_resolution.php
 

Attachments

  • Dawes.jpg
    Dawes.jpg
    41.8 KB · Views: 92
  • Rayleigh.jpg
    Rayleigh.jpg
    49.4 KB · Views: 91
Ron,

What I have in mind for a binocular MTF is a universal scale based on resolution in arc seconds. I drew a crude conceptional representation of an MTF that would allow us to see at a glance how the the contrast curve of any binocular relates to eyesight. It's loosely based on the MTF shown in Rutten and van Venrooij, page 221. That's where the 5% contrast threshold for eyesight when viewing a high contrast target comes from (they suggest 10% for low contrast targets). The bottom scale is true resolution multiplied by magnification, so an 8x binocular with 3" resolution would be 24" on this scale. The vertical line labeled eyesight acuity corresponds to about 20/15 vision, 90 arc seconds. A person with this eyesight acuity cannot resolve line pairs below 90 arc seconds or line pairs of any size with less than 5% contrast, so eyesight is the limiting factor to the right of the acuity line and below the contrast line.

I've plotted three hypothetical 8X42 binoculars with dashed lines. One is really good (crosses the acuity line at 60% contrast), one is less good but still comfortably better than eyesight (crosses the acuity line at about 25% contrast) and one is so poor that it limits the detail the eye can see (crosses the acuity line below the contrast threshold).

This is just a first effort at a MTF appropriate for binoculars. The correct contrast threshold is likely to be a point of discussion and everyone will have their own personal acuity, but with this scale one can choose any acuity or contrast threshold as reference points.

Kimmo,

I trust your measurements of the compacts. My test was only for the effect of reducing the aperture of a large binocular. Something besides aperture must be at work in the compacts.

Henry
 

Attachments

  • DSC_0252.jpg
    DSC_0252.jpg
    46.5 KB · Views: 100
Last edited:
Henry;

OK, I have and idea of what you are suggesting and will look at Rutten tonight. I will give it some thought and try something over the weekend.

Since I have not thought about this much yet, I do not know how much is involved. Some things that may pose a problem is the conversion of standard lp/mm to arc seconds that need to be based on pixel size, focal length and magnification and then inversely sorted. This may be hard to mix different apertures/magnifications into one standard chart. I will see what I can do.


Added: Henry, I have been using 6% as a basis for minimum detectable contrast. I think I got this figure from Optics by Hecht but not sure where I got it. Changing to 5% is not a problem.
 
Last edited:
Apologies for jumping in on your facinating discussion. I'm trying to keep up with it and learning a lot in the process. (Still got a little way to go! ;) )

Surveyor, can I ask you about your method for measuring MTF? If I understand correctly you take a boosted digital image. It would have to be Raw I guess. How do you quantitate the results? Do you use an image analysis tool to plot a histogram through the USAF test chart patterns and normalise the results, or use some other technique e.g. curve fitting?

Many thanks

David
 
Henry, here is a quick and dirty stab at it. Still need to do a lot of checking and proofing to make sure data is being handled properly, much beta testing to do.

One thing I’ve noticed right off, if the stab is close to correct, is that it appears larger objectives are going to have a contrast advantage over the smaller objectives even at the lesser resolutions. Note the contrast % of the 20 mm Promaster; this needs to be checked thoroughly. It may answer a lot of my questions.


EDIT: The curves shown for the Alpha 20's are old and need to be redone. Same as posted to RonH.
 

Attachments

  • Henry Std.jpg
    Henry Std.jpg
    80.1 KB · Views: 363
Last edited:
RonE and Henry and Kimmo,
Go to town, yall!

I sort of hate to interrupt this heady discussion, but I have a request. Could you please extend the spatial frequencies down to zero, like in most MTFs? I know Henry's suggestion started at 120", and that is a good place to start for the discussion of the finest detail visible. But the way a binocular displays large and easily seen things is important too, and depends on junky effects like scattered light, which are interesting.
RonH
 
Warning! This thread is more than 13 years ago old.
It's likely that no further discussion is required, in which case we recommend starting a new thread. If however you feel your response is required you can still do so.

Users who are viewing this thread

Back
Top