How does it get around the different subjects with different accommodation and different acuities? Or, for short, the human factor. Unless it eliminates them from the tests?
Bob
Sorry for my tardiness; I was at a Celtic Woman concert—good show!
While some of my respondents are undoubtedly smarter than me, on this particular issue I’m afraid I will have to leave my comment unaltered. I’m not as bullheaded as some think, but as long as there is a human element, I’ll be forced to let it stand.
Following is a snippet from one of my vignettes. Helpful? Certainly better than most speculation. Infallible? What month is it that pigs fly? :cat:
... A Test for Edge Resolution
Because edge sharpness is so important to some observers who speculate a great deal about exactly where an off-axis image starts getting soft, I hope to offer a quasi-scientific test to add a little data to the speculations.
I once believed the Nikon Prostar binocular provided a slightly crisper off-axis image than the Fujinon FMT-SX. I discussed this with a friend who wondered if I had a way to really know for certain; he, too, had an interest in the outcome. So I came up with the following test.
The Needed Particulars:
1. A rotary table graduated in degrees and fractions that’s either heavy enough to be stable lying on a flat surface or can be affixed to a rigid table top and precisely adjusted with a micrometer head or a smooth moving lead screw. I used a machinist’s 8-inch rotary table. It was heavy enough to be rigid just sitting on a table and had a micrometer adjustment.
2. A homemade “L” bracket or binocular tripod mount that uses a short ¼”-20 bolt to fasten to the binocular’s axle.
3. A round piece of metal turned to fit the hole in the middle of the rotary table and drilled to accommodate a short ¼”-20 bolt to fasten the “L” bracket or tripod mount to it. Other accommodations must be devised for tables not having a circular hole in the center.
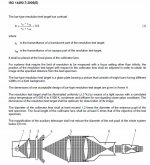
4. A black and white resolution chart gauged at one line per millimeter placed on a well-lighted wall 30 feet from the rotary table. I used the black and white, 1951 US Air Force chart.
The procedure:
1.
Note: Unless the binoculars to be compared—should a comparison be the goal—are of the same aperture and magnification the test will be invalid.
2. Secure the binocular on the “L” bracket or tripod mount to the center of the rotary table (or similar fixture).
3. Turn the dial of the rotary table to place the part of the resolution chart to be observed directly in the center of the field of the telescope you will be using for the test and set the angle to “zero.”
Note: To get the most from this test you should:
—Use the same telescope for all measurements.
—Use the same eye for all measurement.
—Always turn the micrometer or lead screw in such a way as to move the binocular in the same direction.
—Perform all the tests within a reasonably short time frame as fatigue, headaches, stimulants, or medications can affect visual acuity.
4. Start slowly turning the micrometer or lead screw to move the image of the resolution chart toward the edge of the field.
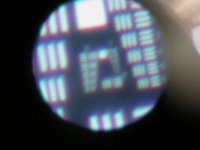
5. The instant the resolution chart turns to a solid gray box stop the test and note the results.
6. “Zero” the set-up and start the second iteration.
7. Perform the test 5 times in all being fastidious about stopping each iteration as soon as the resolution lines turn to a gray square.
8. Discard your lowest and highest readings and take the average of the 3 remaining iterations. This will give you a good idea about how far off-axis (or how close to the edge of the field) the binocular will resolve that particular resolution chart.
Although I was sure the Nikon provided a slightly crisper image, the test didn’t bear it out. Both binoculars resolved all the way to the edge of the field. Even when half the chart was out of the field for both, the remaining half continued to show individual resolution lines. A more aggressive and conclusive test might have been to move the resolution chart 10 feet farther away and perform the test again.


")