Woodchat
Cogito ergo sum
Thought I'd add some photos of the Little Egret from Friday when it performed in front of the hide. It took several fish from the lagoon to the left of the hide in a short space of time including the two captured here by Mrs M. I'll leave it to the experts to decide what the 'grainy' orange/red fish is.
I would suggest that the size, shape and colour are consistent with a male Stickleback - please see exhibit A (first pic
") ) below:
) below:Sticklebacks have been present in the flashes for as long as I can remember so their presence doesn't necessarily suggest any significant changes in the salinity of the flashes.
However, it may well be true that there have been significant increases in the populations of these fish and this may be why Little egrets and Little Grebes are now able to feed in the first and second flashes.
I would suggest that these changes are more likely due to nutrient-enrichment. This (eutrophication) may be due to agricultural runoff of NPK (Nitrogen, Phosphorus, Potassium) fertilizers or it may be due to the accumulations of droppings from certain birds. Birds which actually feed on the flashes (such as waders) would not cause nutrient levels to increase over time (they simply recycle the nutrients that are already present) but those which feed elsewhere but congregate on the flashes (e.g. Geese and Gulls) may import significant levels of nutrients (guano) over time. This increase in nutrient levels could lead to increases in Stickleback food (which may have previously been limiting their populations in the flashes).
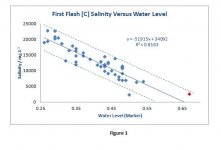
Exhibit B (figure 1) is part of the study I carried out between 2010 and 2012 and shows how the salinity of the first flash varies with dilution (i.e. water level). As you can see, there is significant variation with freshwater (rain) input. I have some data that Arthur Jacobs collected going back to 1970 and all lie within the same range (although these older data do not have any corresponding water-levels which is a shame). I believe that the Trust have collected more data since 2012 so it would be interesting to compare this with the 2010-12 data. If any significant change (p<.05) has occurred, the most recent data would need to consistently lie outside the 95% confidence interval (dashed lines) or show a significantly different gradient /correlation coefficient (much data would be required to prove this).
I hope this makes sense. :t: